Emacs is amazing text editor (let’s treat it as a fact ;) ), but it can become clunky in some situations. For example one day I was working with a big JavaScript file and after a while I’ve notice that even moving a cursor down a few line was slow (to the point where I couldn’t do my work). I’ve stared wondering what is going one. Thankfully Emacs, as usually, has a solution for that. You can run profiler that measures usage of cpu and/or memory of all functions run by Emacs. To do that we can run command (M-x):
profiler-startthen you need to choose what you want to profile. You can type:
- mem - to profile only memory
- cpu - to profile only usage of the processor
- cpu+mem - to profile both memory and the processor
while the profiler is running you can display its result by invoking:
profiler-reportcommand.
To stop profiling you should run:
profiler-stopThe profiler report looks like this:
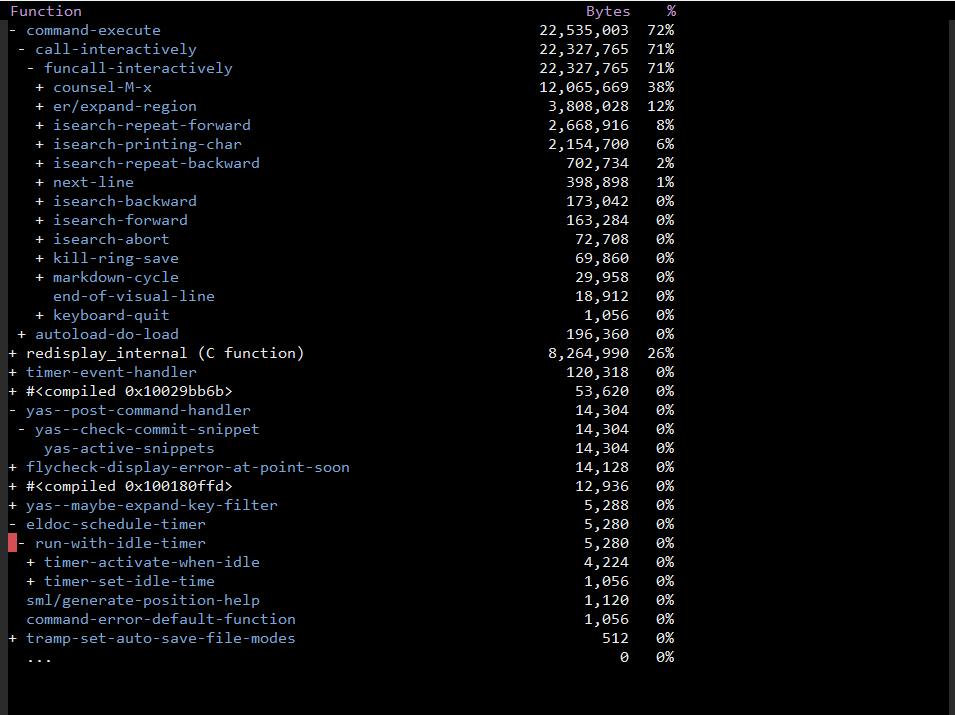
Every line in this report represents invoked function. On the right side of the line we can spot information about how much processor or memory was used by this function. The plus (+) sign near the function name indicate that this item can be expanded to show functions called by the upper function. You can expand such function by the enter key. By pressing enter again you can collapse the whole hierarchy. If you want to see whole call stack you can use C-u RET key stroke.
There are three additional key bindings:
jto go to the function’s definitiondto see the function’s documentation.=to compare two profiling reports
Using this technique I was able to spot that the main slowness in my big JavaScript file was caused by the line numbering feature (global-linum-mode function). When I disabled it I no longer have problems with the performance.
Happy profiling!