I’ve written about NDepend on my blog in August and since then the new version (5) has been released. This is a major update, with many changes and improvements. In this text I focus on parts that are most interesting for me.
Trends
When we work with the code, we introduce changes, which affect whole code base. We can increase or decrease number of lines of code, complexity of the methods, cohesion of methods and many more. All of those informations can be calculated and shown by NDepend. Those statistics show only the condition of the project in the current point of time. It would be very helpful to know how those metrics change in time. What was the complexity two weeks age? How many types did we have one month ago? If we could compare current values with the historical ones we could say if our changes are good for the project, if the quality of the code is increasing. In essence the ‘Trends’ feature give us such possibilities.
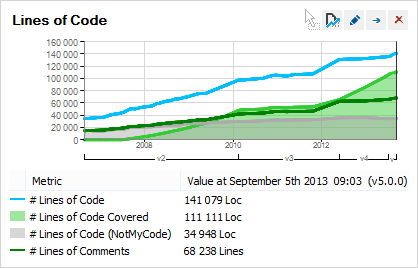
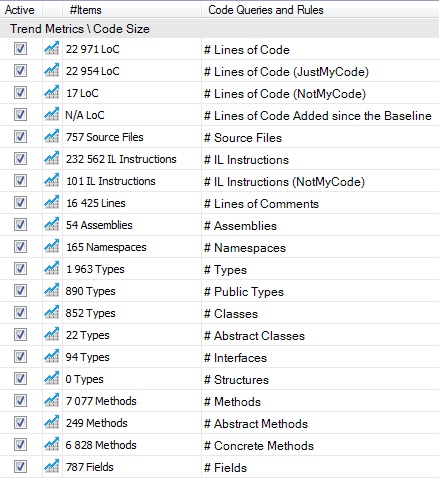
NDepend has now the ability to store it’s own analyzed data and base on it computes charts. On those charts we can see changes of various code metrics in time. The longer we work with NDepend (by default the trends log are calculated once a day) the more accurate our charts are.
By default the tool comes with a set of predefined trend queries. As usual, with NDepend, you can write your own queries (using CQLinq) and use them.
The trends became my favorite, new, feature of NDepend. I can say, that I’m a bit addicted with them. At least once a day I like to spend a few minutes on analyzing them. This gives me a good overview of a whole project.
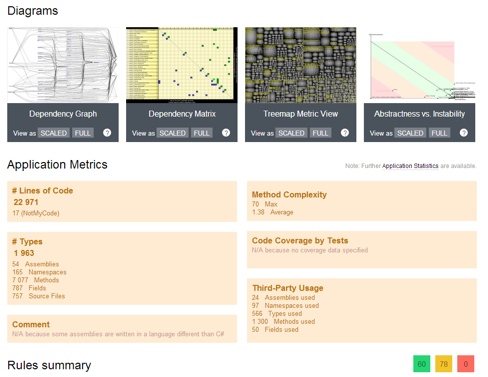
Dashboard
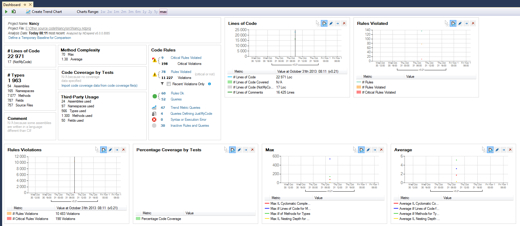
It is always nice to have one, central, place where you can look and see the most important things. NDepend5 introduces such a place in the form of a ‘Dashboard’ view.
The dashboard contains predefined section with basic statistics and code rules. In addition we can change the view by adding various trends charts to it. It is worth mentioning that every chart view can be fully customized.
The dashboard is a nice starting point for using NDepend. For the new users it can also lower the learning curve, giving the advices which features are the most important and should be checked.
New look and feel
The user interface has been completely redesigned in the spirit of ‘flat’ design principles. It uses pastel colors on white backgrounds, clear and easy to read fonts. The GUI is now coherent with Visual Studio 2012/2013 style. When you work with NDepend5 you feel that it’s part of Visual Studio and not a separate add-in.
Still there is a small place to improvement in ‘Metrics’ and ‘Matrix’ views, which, in my opinion, stand out from the rest of the design (maybe it’s because of the colors and the textures?).
Overall I’m pleased with those changes.